
How vine water stress shapes grape and wine quality
This study formed part of the South Africa Wine programme “Grapevine production with limited water resources”, and aimed to evaluate how spatial and temporal water stress affects vine physiology, fruit composition and wine quality.
· 10 min read
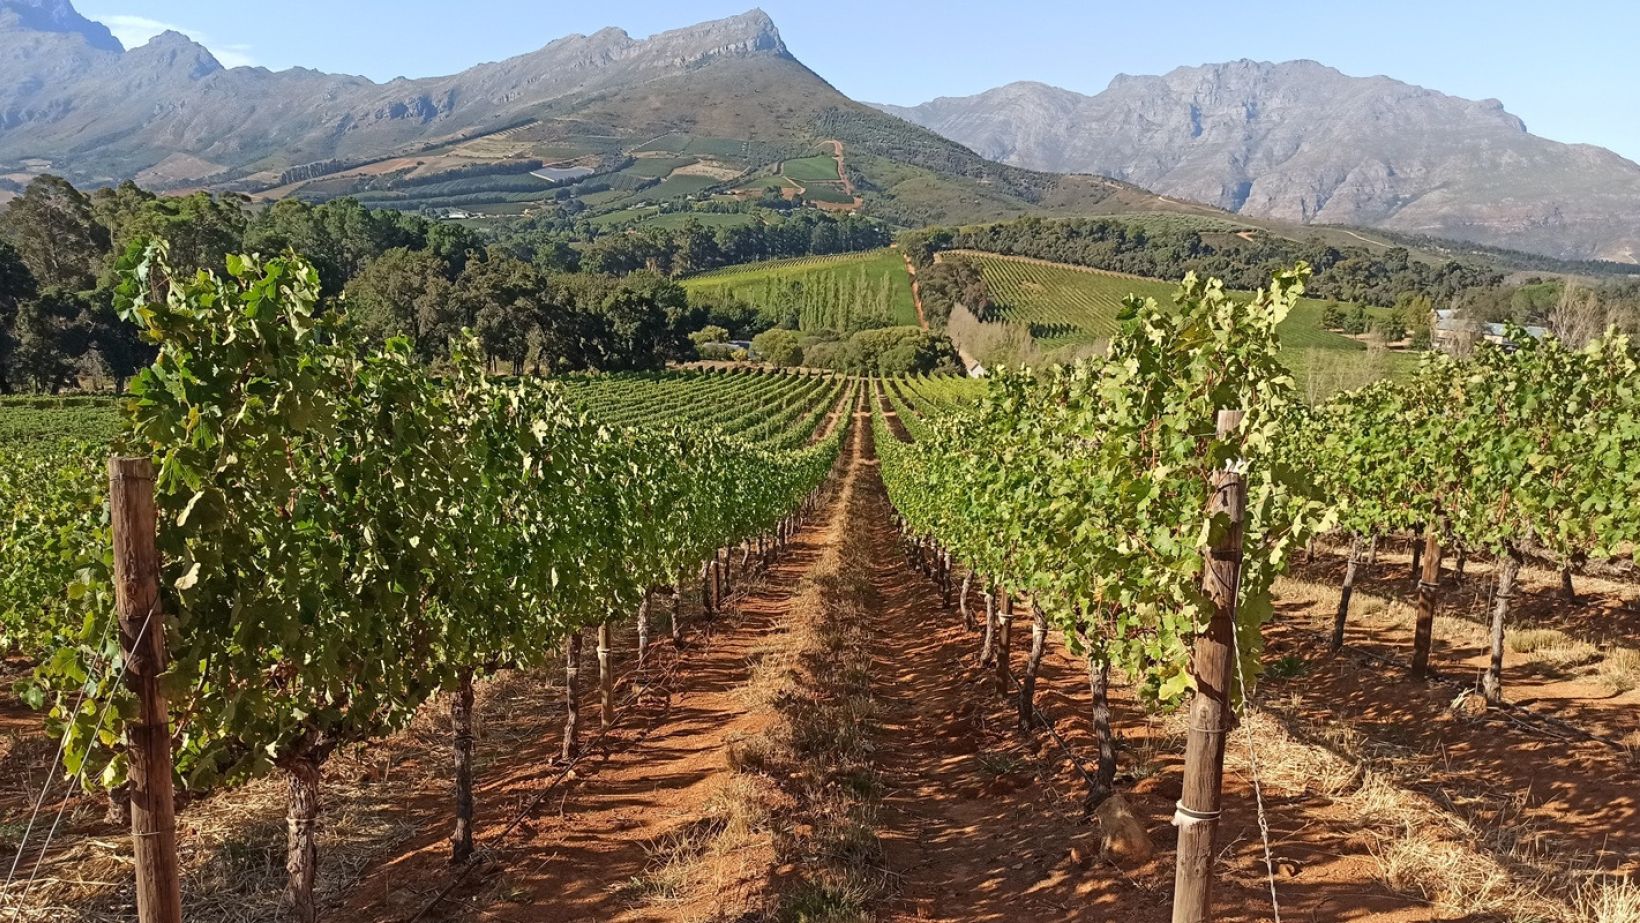
A multi-year study at Thelema Mountain Vineyards found substantial variation in vine water stress within a uniformly managed Cabernet Sauvignon block, with spatial variability exceeding 30%. Vines under severe stress had higher sugar, anthocyanin and tannin concentrations, but significantly lower yields; malic acid did not differ significantly among stress classes. The findings support monitoring vine water status and adapting irrigation by vineyard zone to balance grape composition and production.
Summary written by AI from this article. The full article is under “Deep dive”.
Insights from a multi‑year vineyard monitoring study at Thelema Mountain Vineyards, Stellenbosch.
Introduction
Water is increasingly becoming the scarcest and most strategically important resource for South African viticulture. Warmer summers, declining in‑season rainfall and rising evaporative demand are placing sustained pressure on vineyard water budgets across Western Cape winegrowing regions. These trends are evident in wine premium areas such as Stellenbosch and Paarl and are projected to intensify, with continued drying across key districts (Chauke & Pongrácz, 2023; 2025; Lakhraj-Govender & Grab, 2019). These conditions place increasing pressure on irrigation strategies, highlighting the need for more precise and adaptive approaches to vineyard water management.
Growers today face greater variability in rainfall and increasingly frequent high vapour pressure deficit (VPD) events. These conditions translate directly into altered water‑stress dynamics across irrigated vineyards. As both research and practical experience show, even subtle differences in water availability at key phenological stages can dramatically affect yield and wine quality. In this context, the timing of water stress is critical. Around veraison, when berries soften, colour develops and sugar accumulation accelerates, atmospheric demand often peaks. This is the stage when vine water status becomes highly variable and particularly influential in shaping ripening trajectories and ultimate grape composition (Girona et al., 2006; Van Leeuwen et al., 2009; Acevedo-Opazo et al., 2010; Jasse et al., 2021).
Against this backdrop, a multi‑year study conducted at Thelema Mountain Vineyards (Stellenbosch) provides clear local evidence to date of how vine water status influences grape and wine composition, as well as how spatial variability manifests within a single vineyard block. The study formed part of the South Africa Wine programme “Grapevine production with limited water resources”, and aimed to evaluate how spatial and temporal water stress affects vine physiology, fruit composition and wine quality. By integrating micrometeorological, soil, plant and remote‑sensing measurements, the Digital Viticulture Research Group at the South African Grape and Wine Research Institute (SAGWRI) was able to classify vines into three distinct water‑stress classes and tracked how these classes translated into measurable differences at harvest.
This integrated approach reveals a clear message for irrigated vineyards: even under uniform irrigation, water stress is not uniform, and understanding its spatial dynamics is essential for maintaining yield, optimising quality, and supporting more precise irrigation management under a changing climate.
Materials and methods
Study site and plant material
The study was carried out in a commercial Cabernet Sauvignon vineyard located in the Simonsberg-Stellenbosch region, South Africa (33°54′11.8″S, 18°55′12.4″E; 430 m.a.s.l.). The block (2.24 ha) consisted of cv. Cabernet Sauvignon (clone CS 338C) grafted onto 101‑14 Mgt rootstock, planted in 2003 at 2.5 m × 2.0 m spacing and trained to a vertical shoot‑positioned (VSP) system with bilateral cordons and spur pruning. Irrigation was supplied via drip lines equipped with 2.3 L h⁻¹ emitters spaced at 0.6 m. The area has a Mediterranean climate with winter rainfall, and meteorological data were obtained from the nearest on‑farm automatic weather station.
Selection of target vines and spatial characterisation
To represent intra‑block variability, 43 target vines were selected using a multi‑layer spatial approach. Soil electrical conductivity (ECa) was mapped using an EM38 sensor, trunk circumference was measured for all vines, and vegetation vigour was derived from Sentinel‑2 NDVI layers acquired during previous seasons. These datasets were combined and clustered to delineate variability zones across the block, from which target vines were selected to capture the full range of water‑status conditions.
Plant water status monitoring
Vine water status was assessed weekly from mid‑November to harvest by measuring midday stem water potential (Ψstem) using a Scholander‑type pressure chamber (PMS Instrument Co., Model 1505D). Two mature, shaded leaves per vine were enclosed in plastic bags and wrapped in aluminium foil at least one hour before measurement to allow equilibration with stem water potential. Measurements were taken around solar noon (12:00 - 13:00) to capture maximum atmospheric demand.
Water‑stress class definition
Vines were classified into three water‑stress classes according to the magnitude and persistence of Ψstem:
- Class 1 – low stress: Ψstem > −0.9 MPa.
- Class 2 – moderate stress: −1.2 ≤ Ψstem ≤ −0.9 MPa.
- Class 3 – severe stress: Ψstem < −1.2 MPa.
These thresholds reflect established physiological interpretations of vine water deficit and allowed grouping vines with distinct seasonal water‑status trajectories.
Harvest measurements and grape composition
All target vines were harvested individually. Total yield per vine (kg) was recorded, and berry samples were analysed for total soluble solids (°Brix), pH and titratable acidity using standard oenological procedures. These measurements provided vine‑level resolution of how vine water status influenced fruit development and ripening.
Micro‑vinification and wine phenolic analysis
Fruit from each vine was fermented separately using 2 kg glass micro‑fermenters, following Stellenbosch University’s standard micro‑vinification protocol. Musts were inoculated with Saccharomyces cerevisiae (Lalvin ICV D21) and supplemented with Fermaid K nutrients. Fermentations proceeded at 23°C for 10 days, after which wines were pressed and allowed to complete fermentation to ≤ 2.5 g L⁻¹ of residual sugar. Wine samples were diluted (1:50 in 1 M HCl) and analysed spectrophotometrically (270 - 540 nm) to quantify anthocyanins and tannins. Concentrations were calculated using the PhenoLAB platform, providing standardised phenolic metrics for comparison across vines.
Statistical analysis
All statistical analyses were performed using R software (R Core Team, Vienna, Austria). Differences among water‑stress classes were evaluated using Kruskal-Wallis tests followed by pairwise Wilcoxon comparisons (α = 0.05). Correlation matrices and principal component analysis (PCA) were used to explore multivariate relationships among soil attributes, water‑status dynamics, vine physiology, grape composition and wine phenolics.
Results and discussion
The block was managed as a homogeneous unit by the producer. In Season 1, 43 target vines were selected. After the initial testing season, it was clear that three water-stress classes could be established across the block using weekly stem water potential measurements. Based on these classes, the initial 43 vines were reduced to a total of 33 vines representing the different classes. Harvest data per vine is shown in Table 1. The coefficient of variation for both growing seasons exceeded 30%, indicating a high level of spatial variability within the block.
TABLE 1. Harvest data for two consecutive growing seasons.

n = number of vines.
Classification of vines according to vine water status
Based on the Ψstem measurements collected throughout the season, vines were grouped into three classes according to the level, timing and duration of water stress:
- Class 1 – low water stress.
- Class 2 – moderate water stress.
- Class 3 – severe water stress.
These classes tracked across the season to quantify how differing water‑status trajectories translated into measurable differences at harvest (Jasse et al., 2021).
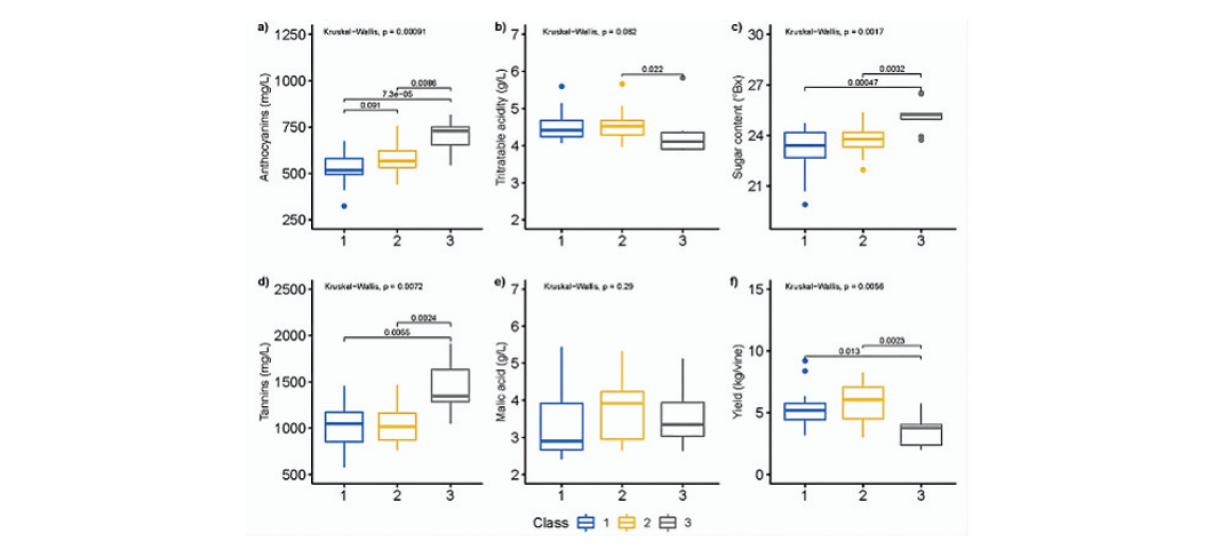
FIGURE 1.Box plot analysis for juice and wine phenolics. a) Anthocyanins, b) Acidity (expressed in g/L), c) Sugar concentration, d) Tannins, e) Malic acid (expressed in g/L), and f) Yield per vine (yield in kg/vine).
The box plots in Figure 1 illustrate the within-class dispersion of each variable and the statistical differences among classes. For malic acid, no significant differences were observed (Figure 1e). In contrast, TA, anthocyanins, tannins, sugar concentration and yield showed significant differences, particularly for Class 3.
Anthocyanin levels in Class 3 were significantly higher than in Classes 1 and 2, with a positively skewed distribution indicating that 50% of the observations exceeded 711.1 mg/L (Figure 1a). Tannins followed a similar trend: Class 3 displayed significantly higher values, coupled with a narrow second quartile, indicating that 50% of the plants exceeded 1 427.7 mg/L, with a mean of 1 911.2 mg/L (Figure 1d). Some authors argue that wine tannin concentrations can only be modified under high levels of water deficit (e.g., Yu and other authors, 2020); however, our results demonstrate that moderate changes in plant water status can also influence tannin and anthocyanin concentrations in wine. This trend is consistent with findings by Kennedy and other authors (2002), who also reported an increase in tannin concentration in response to water deficit.
Sugar concentration was similar between Classes 1 and 2; however, Class 3 exhibited markedly higher values with a narrow range (23.7 - 26.5°Brix), indicating low within-class variability (Figure 1c). Yield showed the opposite pattern: Class 3 had significantly lower production than Classes 1 and 2. Half of the vines in Class 3 yielded less than 3.56 kg/vine, whereas more than 75% of the plants in Classes 1 and 2 produced over 4.26 kg/plant (Figure 1f).
In this experiment, tannin and anthocyanin levels increased by 27% and 23%, respectively, from Classes 1 - 2 to Class 3. Wines produced from Class 1 vines showed a 24% lower total phenolic content, confirming that water deficit was strongly associated with the observed compositional changes and overall wine quality.
Practical implications of the results
The results highlight the need for systematic monitoring of vine water status rather than relying solely on visual assessment or grower experience. While stem water potential remains the most robust physiological indicator, as demonstrated in the preceding results, its implementation at scale is challenging due to its labour‑intensive and destructive nature. To address these limitations, the Digital Viticulture Research Group is actively investigating and developing new technologies, including thermography, advanced sensors and remote sensing approaches. These tools offer high temporal and spatial resolution and can be used to detect water‑stress gradients within vineyard blocks.
This study clearly shows that spatial variability is substantial, often exceeding 30% even under uniform management practices. Such heterogeneity underscores the importance of identifying and managing zones of high-water stress independently rather than applying block‑level strategies.
The results also confirm a marked quality-yield trade‑off. Vines subjected to severe water stress (defined as Class 3 in this study) produced berries with higher anthocyanin, tannin and sugar concentrations, but these compositional gains were accompanied by a significant reduction in yield.
Consequently, the results suggest that irrigation strategies aimed at maintaining a controlled, moderate water stress, offers the most balanced outcome by enhancing berry composition, while preserving yield and ensuring sustainable production. Ultimately, effective vineyard water management requires moving beyond uniform irrigation approaches towards spatially informed and dynamically adapted strategies.
Acknowledgements
- Thelema Mountain Vineyards, particularly Victor Rossouw, for logistical support to the project.
- Digital Viticulture Research Group at Stellenbosch University (Anke Berry, Jaco Luus, Talitha Venter and Stenford Matsikidze). Special thanks are extended to Aladino Jasse, MSc student, for his work on thermography analysis.
- Pamela Uribe for her contributions to the language editing and grammatical review of the manuscript.
- This study was funded by South Africa Wine Water Programme (Grapevine production with limited water resources; project: FShip Water1).
References
Acevedo‑Opazo, C., Ortega‑Farias, S. & Fuentes, S. (2010). Effects of grapevine (Vitis vinifera L.) water status on water consumption, vegetative growth and grape quality: an irrigation scheduling application to achieve regulated deficit irrigation. Agricultural Water Management, 97(7), 956-964. https://doi.org/10.1016/j.agwat.2010.01.025
Chauke, H. & Pongrácz, R. (2023). The validation of climate in the wine‑growing region of the Western Cape of South Africa. Theoretical and Applied Climatology. https://doi.org/10.1007/s13137-023-00244-7
Chauke, H. & Pongrácz, R. (2025). Future Climate Trends in the Wine-Growing Regions of the Western Cape of South Africa. Atmosphere, 16(2), 227. https://doi.org/10.3390/atmos16020227
Girona, J., Mata, M., del Campo, J., Arbonés, A., Bartra, E. & Marsal, J. (2006). The use of midday leaf water potential for scheduling deficit irrigation in vineyards. Irrigation Science, 24(2), 115-127. https://doi.org/10.1007/s00271-005-0015-7
Intra‑block spatial and temporal variability of plant water status and its effect on grape and wine parameters. Agricultural Water Management, 250, 106696. https://doi.org/10.1016/j.agwat.2020.106696
Jasse, A., Berry, A., Aleixandre‑Tudo, J. L. & Poblete‑Echeverría, C. (2021).
Kennedy, J. A., Matthews, M. A., & Waterhouse, A. L. (2002). Effect of maturity and vine water status on grape skin and wine flavonoids. American Journal of Enology and Viticulture, 53(4), 268-274. https://doi.org/10.5344/ajev.2002.53.4.268
Lakhraj-Govender, R. & Grab, S. W. (2019). Rainfall and river flow trends for the Western Cape Province, South Africa. South African Journal of Science, 115(9/10), Article #6028. https://doi.org/10.17159/sajs.2019/6028
Van Leeuwen, C., Trégoat, O., Choné, X., Bois, B., Pernet, D. & Gaudillère, J.‑P. (2009). Vine water status is a key factor in grape ripening and vintage quality for red Bordeaux wine. How can it be assessed for vineyard management purposes? OENO One, 43(3), 121-134. https://doi.org/10.20870/oeno-one.2009.43.3.798
Yu, R., Brillante, L., Martínez-Lüscher, J. & Kurtural, S. K. (2020). Spatial variability of soil and plant water status and their cascading effects on grapevine physiology are linked to berry and wine chemistry. Frontiers in Plant Science, 11, 790. https://doi.org/10.3389/fpls.2020.00790
For more information, contact Professor Carlos Poblete-Echeverría at [email protected].
Click here to get your copy of WineLand Magazine.

More from
Innovation and insights
Drought tolerance of different scion cultivars (Part 4): Vegetative growth and yield
The study aimed to assess grapevine vegetative and yield responses in an almost worst-case scenario, i.e. grapevines growing under dryland conditions in sandy loam soil in the Swartland region.
Hairy roots - a biotechnological tool for grapevine improvement
Hairy roots arise when the phytopathogenic bacterium, Rhizobium rhizogenes inserts DNA into a wounded plant’s genome, triggering the formation of rapidly growing root masses. The rapid growth and relatively fast establishment of hairy roots led to their use in laboratories, where they are used to…
To swirl or not to swirl? - that is the question... (Part 2)
This study investigated the sensory suppression effects of H2S on tropical fruit characters and evaluated whether the perceived improvement following swirling is a result of chemical oxidation or physical volatilisation.