
Domestic consumption trends

· 1 min read

Here’s a graph depicting the trend in domestic wine consumption from 1945 to 2016.
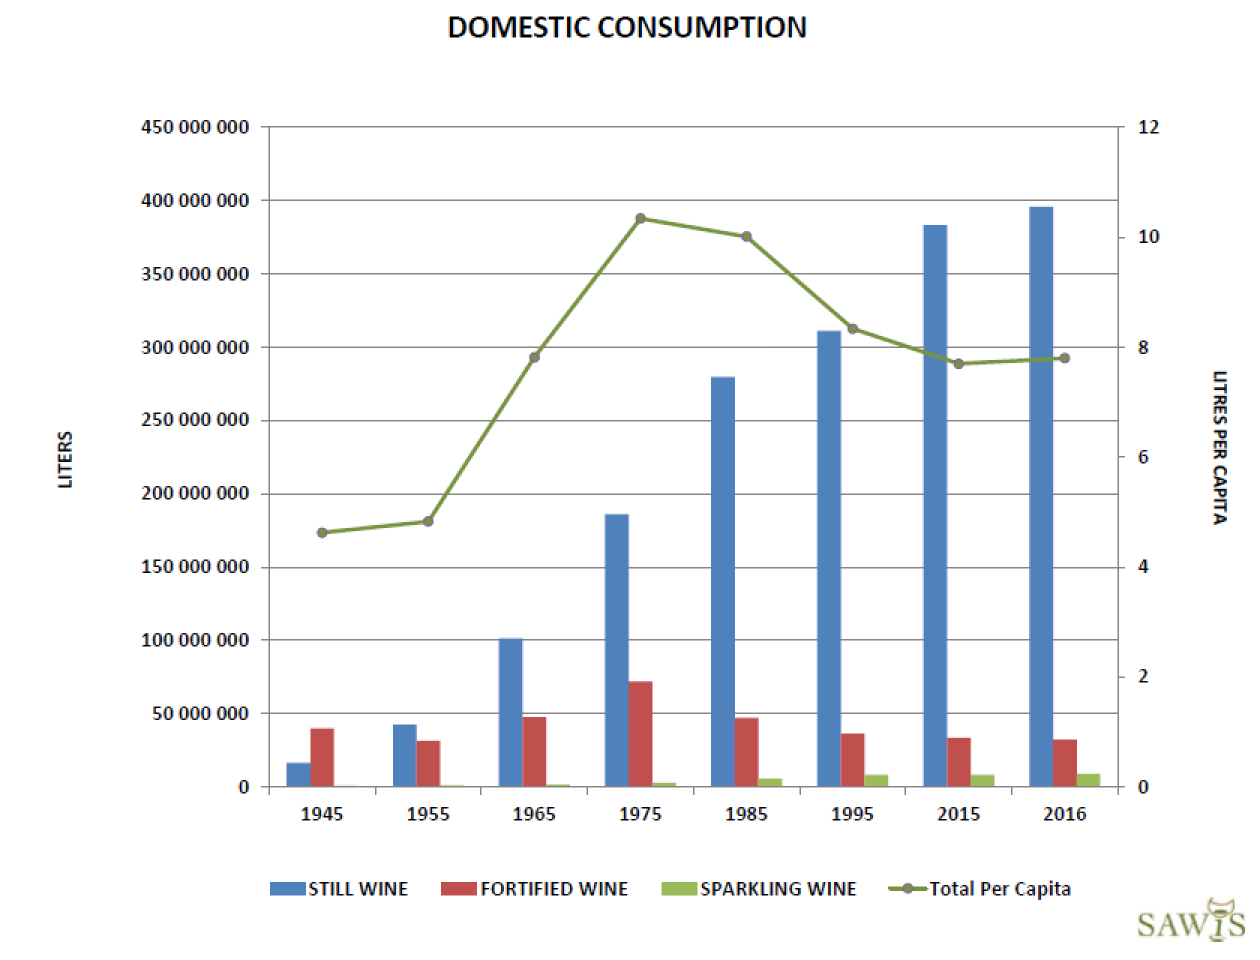
Some interesting trends emerge:
- Fortified wine consumption has declined since 1975 and the downward trend seems to be continuing
- Sparkling wine consumption has increased marginally, but remains comparatively low
- The consumption of still wine has steadily been increasing since the late 1950s.
Finally, there was a strong decrease in total per capita consumption after 1975. Wine consumption suddenly stopped tracking with population growth. This development was not due to a new tax or even legislation. The relative drop in domestic wine-drinking habits can be traced directly to the increase in beer consumption as a substitute for wine: South African beer consumption doubled between 1974 and 1978. The beer surge obliterated a large chunk of market share from the wine industry.
The good news is that 40 years later, the trend seems to have turned a corner. Per capita wine consumption has been showing signs of recovery since 2015. A new generation is turning to wine as their tipple of choice. This represents a golden opportunity for the wine industry.

More from
Markets, business and trade

How research is changing the wine we drink
Wine research starts long before the bottle reaches the shelf. It gives producers a better understanding of what happens in the vineyard and cellar, while providing evidence for decisions that can affect the wine consumers eventually drink.

Precision Fermentation: Biotech to balance Flavours, Acid and Alcohol
As warmer vintages widen the gap between ripeness and freshness, a new generation of selected yeasts lets winemakers rebalance wine during fermentation, not after.

WBWE – a global business barometer
If you want to understand where the global wine industry is heading, don’t look only at retail shelves or export statistics. Look at what is happening in the bulk wine market.