
Irrigation strategy and trellis system (Part 2): Yield of Pinotage grapevines in the Breede River Valley region
The primary objectives of the study were to determine during what stage(s) Pinotage is sensitive to water deficits, the most suitable irrigation strategy when water restrictions are imposed during periodic droughts, and if more grapes can be produced with the same volume of irrigation water when…
· 23 min read
Abstract
Pinotage is a South African-bred red wine cultivar and is second only to Shiraz in terms of the country’s wine exports. Since rainfall in the Breede River Valley region is low, grapevines in this region require irrigation. The sensitivity of Pinotage/99R to water deficits and the most suitable irrigation strategy during water restrictions were studied in a field trial from 1998/99 until 2000/01. Irrigation strategies entailed combinations of 50% readily available water (RAW) depletion, 75% RAW depletion and no irrigation between various phenological stages, viz. budbreak, flowering, pea size berries, véraison, 17°B and harvest. Irrigation applied at 50% RAW depletion from budbreak in September until harvest in February was regarded as the control. The possibility to produce more grapes with the same volume of irrigation water was also investigated, and each experimental plot was split into a six-strand vertical hedge and a two-tier vertical trellis. The experimental layout was a split-plot, randomised block design. Pinotage berry mass was most sensitive to water deficits during the pre-véraison period, as well as continued water deficits from budbreak to harvest. This eventually reflected in the yield of the Pinotage grapevines. Results showed that it is possible to produce more grapes with the same volume of irrigation water by extending the bearing capacity of grapevines vertically. Furthermore, it is also possible to produce more grapes with less water, and in doing so reduce the blue water footprint, or increase the irrigation water use efficiency, of wine grapes in a profitable way.
Introduction
Irrigation resources are generally limited in the grape-producing regions of South Africa.1 The Breede River Valley production region has a Mediterranean climate with most of the rainfall in winter. Therefore, grapevines growing in this region depend entirely on irrigation. Considering the possible effects of climate change on viticulture, the worst-case scenario would be that lower rainfall reduces natural water resources and higher air temperatures increase the vineyard water requirements. Even if climate changes do not affect vineyard evapotranspiration, grape growers still need to use irrigation water more efficiently, but without compromising yield and wine quality.
Pinotage is a South African red wine grape cultivar that was bred locally by Professor Perold.2 It is the most widely planted, locally bred cultivar in South Africa. The total area of vineyards planted to Pinotage comprises ca. 7.5% of the total area of South African wine grape vineyards.3 Thirty two percent of the Pinotage vineyards are located in the Breedekloof, Robertson and Worcester areas of the Breede River Valley. In terms of wine exported from South Africa, Pinotage is second only to Shiraz. Despite the popularity of the cultivar, there is no knowledge on the sensitivity of Pinotage yield and its components to water constraints if water resources for irrigation are, or become, limited. Although vegetative growth can be manipulated by means of irrigation, grape yield also decreases with less irrigation.4,5,6,7,8,9,10,11,12,13 In drought situations, water restrictions could be imposed, thereby forcing growers to manage the limited available water to obtain maximum benefits. In order for growers to make informed decisions regarding the irrigation of their vineyards if water becomes limited, information is needed on the effect of water constraints during the different phenological stages of the grapevine.
The water footprint (WF) of an agricultural product is the volume of water required to produce one unit of the product.14 The purpose of the WF is to create awareness of the impact that the water used for agricultural production has on the environment. The total WF of an agricultural crop is subdivided into three components, i.e. the green (WFgreen), blue (WFblue) and grey (WFgrey), respectively.14 The WFblue is the volume of surface and groundwater used to produce a crop. Given the drive towards eco-friendly grape production, as well as limited water resources, grape growers need to follow measures to ensure the lowest water footprint that is practically possible. In addition, ever increasing water tariffs and energy costs are continuously challenging growers to adopt irrigation practices that will ensure sustainable grape production. In this regard, the published water footprint values are useful as benchmarks for growers to evaluate the situation on their farms, and to reduce the water footprint of their vineyards where practically possible. In practice, however, grape growers can only manipulate the WFblue. The irrigation water use efficiency (WUEi), which is defined as the unit crop produced per unit of irrigation water, is also a measure for the efficacy of irrigation management. At the farm level, the WFblue can be reduced, or the WUEi can be increased based on two approaches, i.e. either use less water to produce the same yield or produce higher yields with the same volume of water.
There are various practical ways in which the WFblue or WUEi vineyards can be improved. More specifically, it is possible to produce more grapes on bigger trellis systems15 with the same volume of irrigation water.16,17 However, higher yields are mostly obtained on horizontal trellis systems. Since adequate water and deep, fertile soils are crucial for sustaining grapevines on large trellis systems, the latter might not be a viable option where water resources are limited. Another option would be to increase the bearing capacity of a vineyard vertically. This can be achieved by training every second grapevine onto a higher cordon wire. Although this so-called two-tier vertical trellis system is already used by some growers, no scientific evidence on the advantages and disadvantages of the two-tier trellis could be found in literature. However, this system holds promise to increase the effective use of irrigation water.
Taking the above-mentioned into consideration, the primary objectives of the study were to determine (i) during what stage(s) Pinotage per se is sensitive to water deficits, (ii) the most suitable irrigation strategy when water restrictions are imposed during periodic droughts, and (iii) if more grapes can be produced with the same volume of irrigation water when the bearing capacity of grapevines is increased.
Methods
Experimental vineyard
The field trial was carried out over three seasons, i.e. from 1998/99 until 2000/01, in a three-year-old Pinotage/99Richter vineyard on the Agricultural Research Council (ARC) Research Farm near Robertson in the Breede River Valley of South Africa. Details have been given previously.18 Briefly, based on the growing degree days (GDD) of 1 497°C from 1 September to 31 March,19 the specific locality is in a class II climatic region that has the potential for the production of good quality red and white table wine.20 The sandy clay loam of the experimental vineyard was representative of the Hutton and Sterkspruit forms21 and was deep delved to ca. 90 cm before planting. Grapevines were planted at a spacing of 2.75 m × 1.50 m. Irrigation was applied over the total area using 32 L/hour Eintal® micro sprinklers. Standard viticultural management practices were applied in the experimental vineyard. The vineyard was mechanically cultivated only to establish Avena sativa L. cv. Pallinup (oats) as a winter cover crop. Full surface chemical control was applied before budbreak.
Experimental layout
To determine the effect of water deficits at various stages, different irrigation strategies were applied. These irrigation strategies consisted of eight different combinations of 50% readily available water (RAW) depletion, 75% RAW depletion and no irrigation between various phenological stages, viz. budbreak, flowering, pea size berries, véraison, 17°B and harvest. Irrigation applied at 50% RAW depletion from budbreak in September until harvest in February was regarded as the control (S1). For the purpose of this study, RAW was defined as the water available between -5 kPa and -100 kPa soil matric potential. The experimental layout was a split-plot, randomised block design. Each experimental plot was split into a six-strand vertical trellis and a two-tier vertical trellis to give a total of 16 irrigation strategy/trellis system combinations, or treatments. Each strategy/trellis system combination was replicated three times.
Grapevines were developed onto the respective trellis systems from establishment onwards. The cordon arms of grapevines on the two-tier trellis were developed to a length of 3 m (Figure 1). The total height of both trellis systems was 1.8 m. Plots consisted of eight experimental grapevines with two border grapevines at each end, as well as two border rows on either side of the experimental row to limit possible overlapping of treatment effects. Each experimental plot covered 247.5 m2.
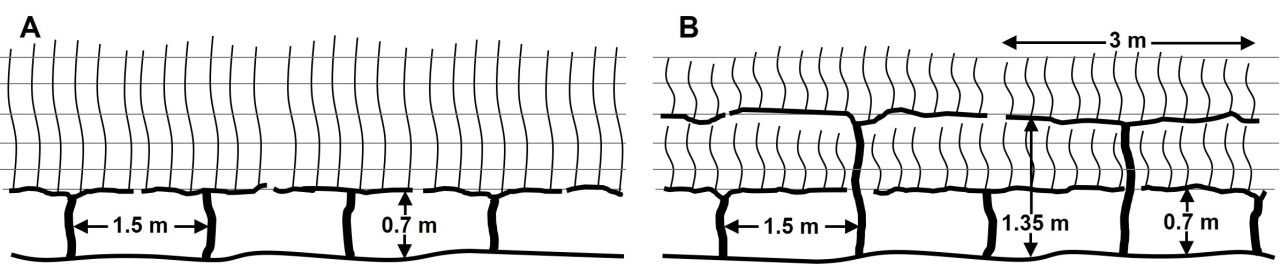
FIGURE 1. Schematic illustration of grapevines trained onto the (A) six-strand vertical trellis and (B) two-tier trellis.
Application of irrigation strategies
Soil water matric potential was measured weekly, as well as before and after irrigations, using tensiometers installed at 30 cm, 60 cm and 90 cm depths. Based on soil water retention curves, 50% and 75% RAW depletion amounted to soil matric potentials of ca. -35 kPa and -65 kPa, respectively. Irrigation volumes of selected irrigation strategies were measured by means of water meters. Grapevines were not irrigated during winter months.
Yield components
Véraison was defined as the stage when visual observation showed that c. 95% of grape berries had changed colour. This was equivalent to stage 36 of the modified Eichhorn and Lorenz grapevine growth identification system.22 At harvest, all the bunches in each experimental plot were picked and counted. The grapes were weighed to obtain the total mass per plot. Mean yield per grapevine was calculated and converted to tons per hectare. Bunch mass was determined by dividing the total grape mass per plot by the number of bunches per plot. The number of bunches per grapevine was calculated by dividing the total number of bunches per plot by the number of experiment grapevines per plot. Fresh berry mass was determined at harvest in all the plots by picking 20 berries from each of 10 bunches per plot. The samples were weighed using an electronic balance.
Blue water footprint and water use efficiency
The WFblue in m3 water per ton of grapes produced and the WUE in kg of grapes produced per m3 of water applied were calculated for S1 and S7 for the 2000/01 season. The amount of irrigation water applied to S1 and S7 was 584 mm and 407 mm, respectively. The yield of the S1 grapevines was 23.5 t/ha and 31.6 t/ha for the six-strand hedge and two-tier trellis, respectively. The yield of the S7 grapevines was 19.3 t/ha and 29.2 t/ha for the six-strand hedge and two-tier trellis, respectively.
Statistical analyses
Raw data was captured and sorted in Microsoft® Excel. The data were subjected to an analysis of variance (ANOVA) by using Statgraphics®. Least significant difference (LSD) values were calculated to facilitate comparison between treatment means. Means which differed at p ≤ 0.05 were considered significantly different.
Results
It must be noted that some of the results of S1 and S7 on the two trellis systems have been summarised previously.1 The results obtained with both the trellis systems and all the irrigation strategies will be discussed in detail below.
Soil water status and irrigation volumes
Grapevines were generally irrigated once a week to maintain 50% RAW depletion during summer. In order to allow 75% RAW depletion, irrigation was applied every 10 to 14 days depending on the weather (Figure 2). On average, 619 mm of water was applied to the control strategy (S1) over the three seasons. Irrigation of grapevines at 75% RAW depletion from budbreak until harvest (S7) required 462 mm of water. Where water deficits were imposed from flowering to véraison (S3), an average of 572 mm of water was applied over the three years of the study. For grapevines irrigated at 75% RAW depletion with 50% RAW from flowering to véraison (S6), 509 mm of water was applied. It must be noted that grapevines on the two trellis systems received the same volume of irrigation water.
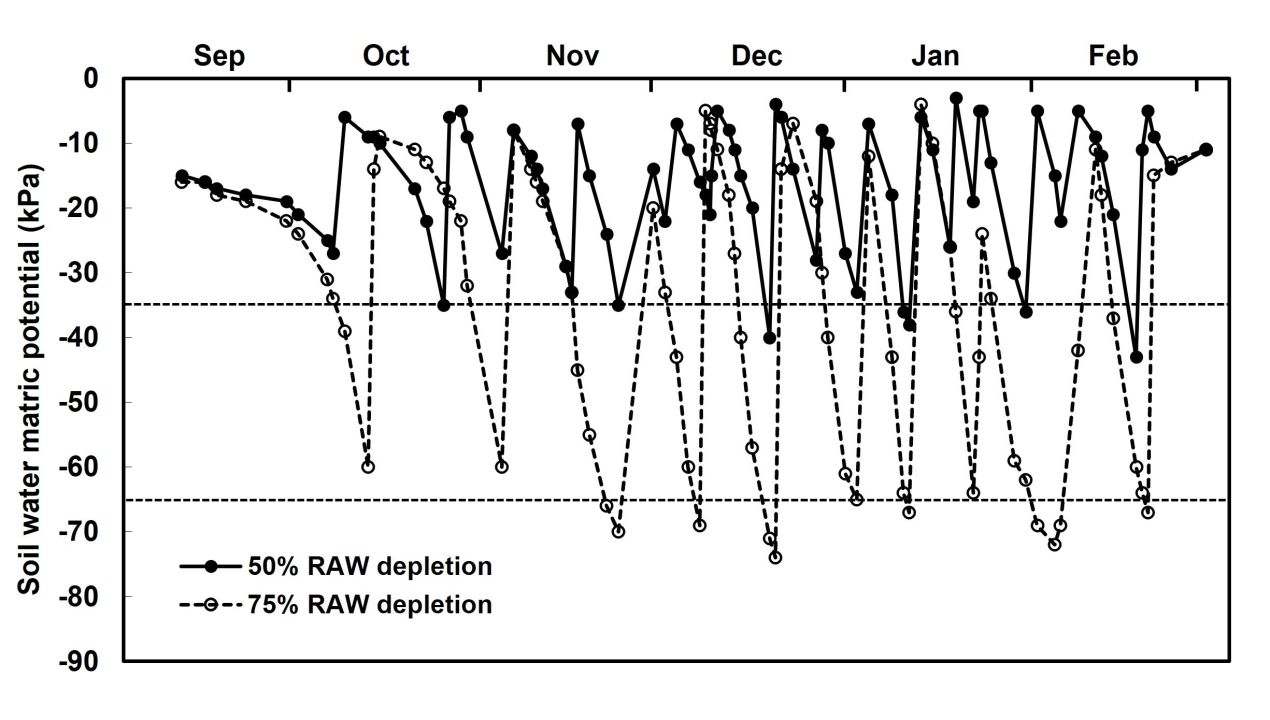
FIGURE 2. Seasonal variation in soil water matric potential (Ψm) where Pinotage grapevines were irrigated at two readily available water (RAW) depletion levels in the 2000/01 season near Robertson (redrawn1). Horizontal dashed lines indicate the target Ψm values for 50% and 75% RAW depletion, respectively.
Yield and its components
Effect of trellis system
Considering the means over the three seasons, grapevines on the two-tier trellis bore substantially more bunches than the six-strand hedge (Figure 3A). Based on the shoot counts carried out in 2000/01, grapevines bore 1.8 bunches per shoot, irrespective of trellis system or irrigation strategy. This was slightly less than the target of two bunches per shoot. However, grapevines on the two-tier trellis bore only ca. 50% more bunches per grapevine than those on the six-strand hedge (Figure 3A). This was due to the wider spur spacing on the two-tier trellis, which on average, resulted in only 60% more shoots per grapevine than on the six-strand hedge. In general, trellis system did not seem to have any effect on Pinotage berry mass over the three seasons of the study (Figure 3B). On average, bunches were smaller on the two-tier trellis than on the six-strand hedge (Figure 3C). As expected, the yield on the two-tier trellis was higher compared to the six-strand hedge (Figure 3D). It is noteworthy that the average yield obtained on the six-strand hedge was still within the norm of 10 - 15 t/ha proposed for Pinotage.2 As expected, the yield for the two-tier trellis was above this norm.
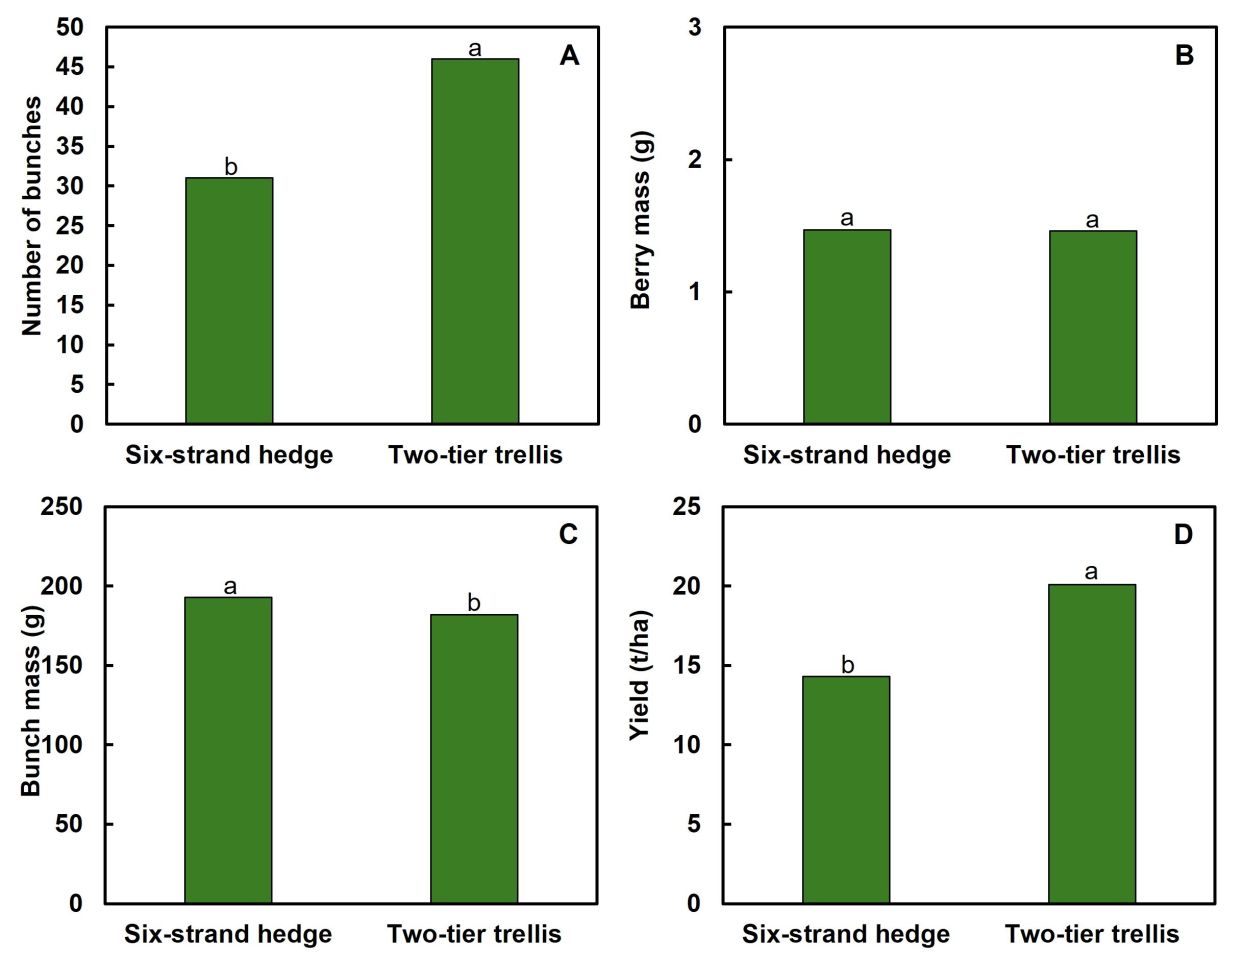
FIGURE 3. Effect of two trellis systems on mean (A) number of bunches, (B) berry mass, (C) bunch mass, and (D) yield of Pinotage/99R over three seasons near Robertson. Columns designated by the same letters do not differ (p ≤ 0.05).
Effect of irrigation strategies
Considering the mean values, grapevines which received the least irrigation (S7 and S8) had less bunches per grapevine compared to S1 and S2, which received the most irrigation (Figure 4). Likewise, severe water constraints tended to reduce number of bunches compared to well-watered grapevines.23,24
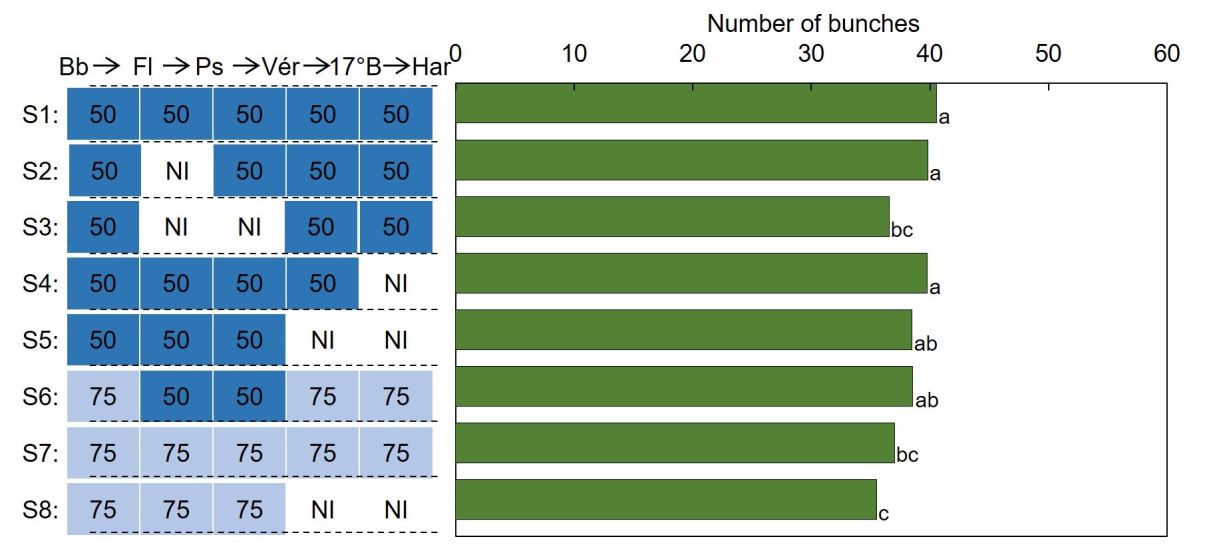
FIGURE 4. Effect of different irrigation strategies (S), i.e. combinations of 50% readily available water depletion (50), 75% readily available water depletion (75), and no irrigation (NI) between various phenological stages, namely budbreak (Bb), flowering (Fl), pea size berries (Ps), véraison (Vér), 17°B and harvest (Har) on number of bunches of Pinotage/99R near Robertson in the Breede River Valley. Data are means for three years. Columns designated by the same letters do not differ (p ≤ 0.05).
Irrigation applied at 75% RAW depletion throughout the season (S7) or stopped at véraison (S8) reduced berry size compared to S1 (Figure 5). Previous studies also showed that continued water deficits from budbreak until harvest reduced berry size.10,24,25,26 Water deficits from flowering to pea size berries (S2) only tended to reduce berry size of Pinotage compared to continued irrigation at 50% RAW depletion (S1) (Figure 5). In contrast, prolonged water deficits from flowering until véraison (S3) caused a more pronounced reduction in berry size compared to S1. The reduced berry size caused by pre-véraison water deficits agrees with earlier findings.23,25,27 Irrigation applied at 50% RAW depletion and stopped at véraison (S5), as well as 75% depletion stopped at véraison (S8) reduced berry mass (Figure 5). Post-véraison water deficits caused a similar reduction in berry size of Cabernet Franc.23
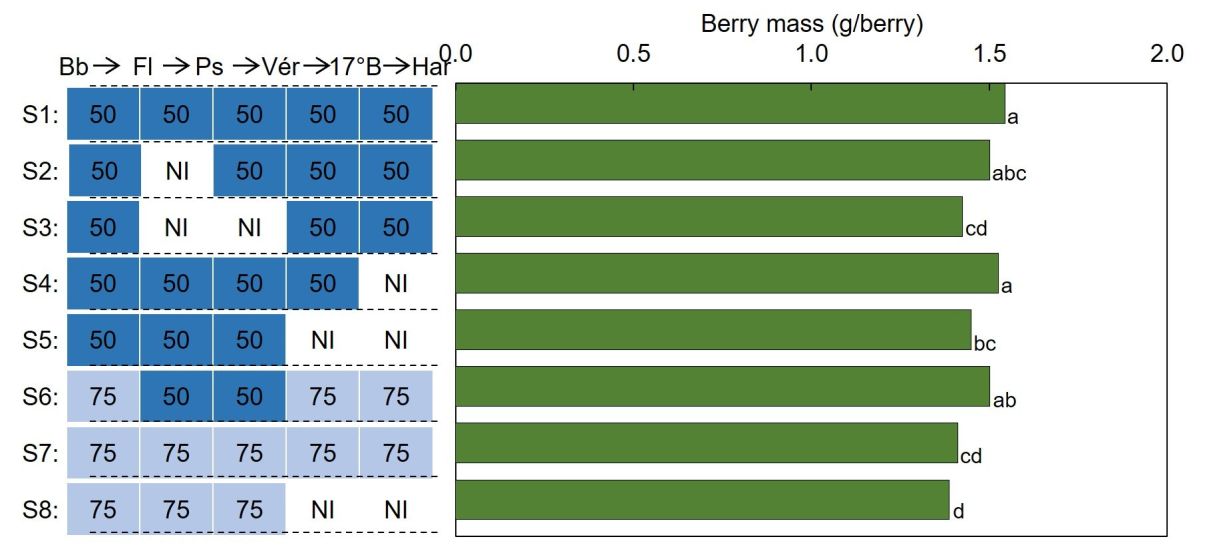
FIGURE 5. Effect of different irrigation strategies (S), i.e. combinations of 50% readily available water depletion (50), 75% readily available water depletion (75), and no irrigation (NI) between various phenological stages, namely budbreak (Bb), flowering (Fl), pea size berries (Ps), véraison (Vér), 17°B and harvest (Har) on berry mass of Pinotage/99R near Robertson in the Breede River Valley. Data are means for three years. Columns designated by the same letters do not differ (p ≤ 0.05).
On average, grapevines produced the smallest bunches where the driest irrigation strategy, i.e. where irrigation at 75% depletion was stopped at véraison (S8), was applied (Figure 6). This trend agrees with previous findings.23,24,27 Grapevines that were subjected to water deficits from budbreak until harvest (S7) produced smaller bunches compared to more frequent irrigation throughout the season (S1) (Figure 6). Similar results were previously reported by other researchers.9,10,11,24 Pre-véraison deficits (S2 & S3), as well as deficits during berry ripening (S5), reduced bunch mass compared to S1 (Figure 6). The sensitivity of bunch mass to pre-véraison water constraints was also reported in a previous study.27
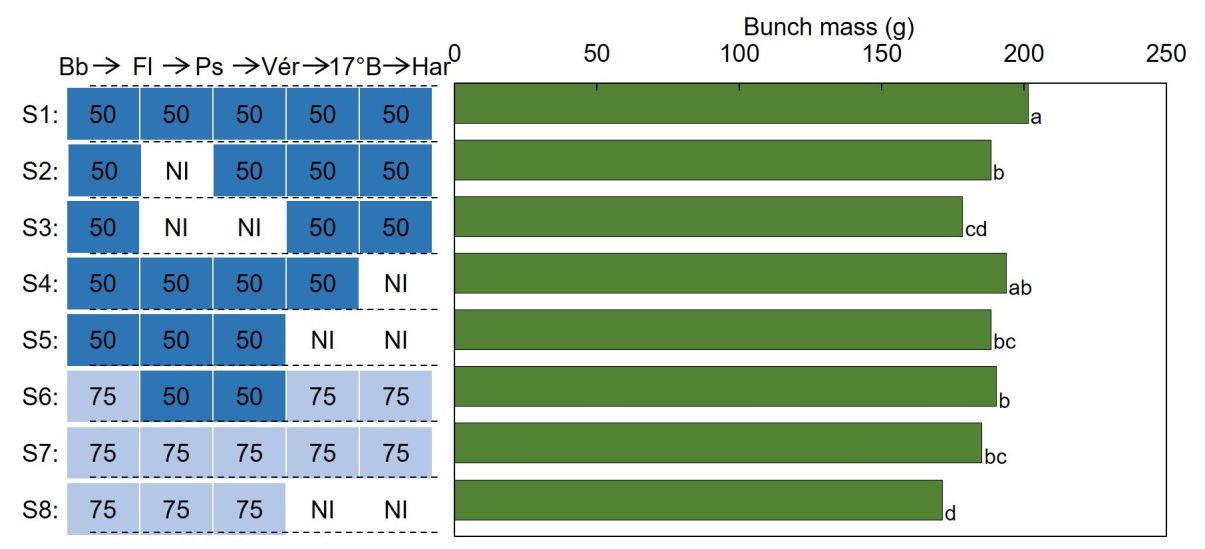
FIGURE 6. Effect of different irrigation strategies (S), i.e. combinations of 50% readily available water depletion (50), 75% readily available water depletion (75), and no irrigation (NI) between various phenological stages, namely budbreak (Bb), flowering (Fl), pea size berries (Ps), véraison (Vér), 17°B and harvest (Har) on bunch mass of Pinotage/99R near Robertson in the Breede River Valley. Data are means for three years. Columns designated by the same letters do not differ (p ≤ 0.05).
On average, Pinotage grapevines irrigated at 75% RAW depletion throughout the season (S7) produced less grapes than those irrigated at 50% depletion throughout the season (S1) (Figure 7). Likewise, higher levels of soil water depletion maintained from budbreak to harvest reduced yield of Manto Negro and Tempranillo,28 Castelão,24 Merlot,10 Shiraz,9,11 Cabernet Sauvignon,29 Verdejo13 and Bobal.26 In contrast, Merlot grapevines only tended to produce lower yields when subjected to a higher level of soil depletion from budbreak to harvest.12 Grapevines irrigated at 50% RAW depletion from budbreak to harvest (S1) produced the highest yields. The lowest yields were produced where irrigation at 50% RAW depletion was stopped from flowering to véraison (S3) and where irrigation at 75% depletion was stopped at véraison (S8). The sensitivity of grape yield towards pre-véraison, as well as post-véraison water deficits, agrees with previous findings.23,27 It is noteworthy that the average yield (Figure 7) obtained with the least irrigation, i.e. S8, was within the proposed norms for Pinotage.2
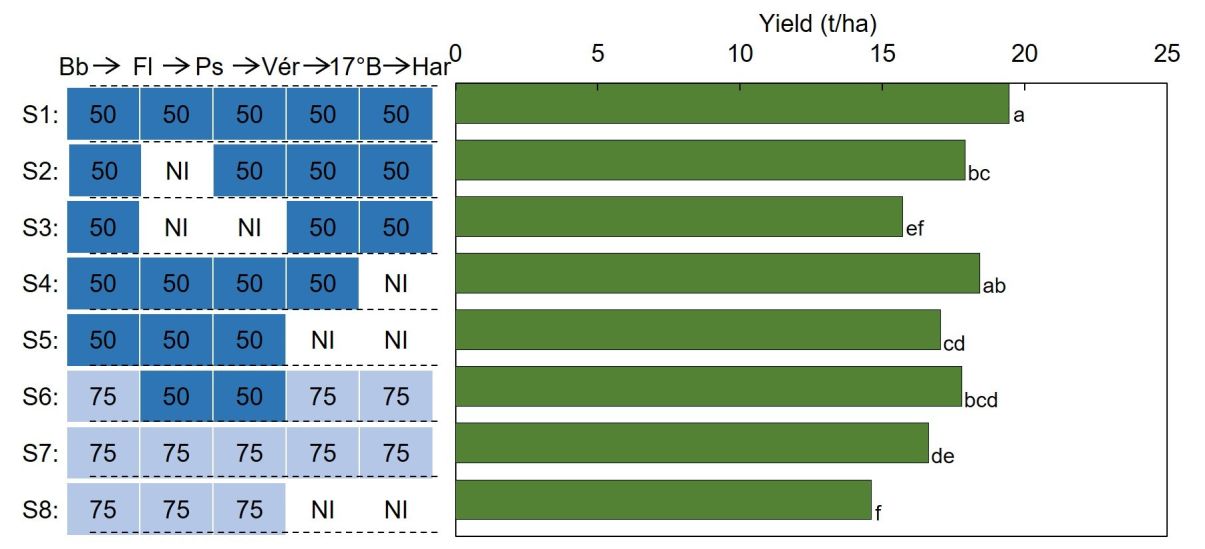
FIGURE 7. Effect of different irrigation strategies (S), i.e. combinations of 50% readily available water depletion (50), 75% readily available water depletion (75), and no irrigation (NI) between various phenological stages, namely budbreak (Bb), flowering (Fl), pea size berries (Ps), véraison (Vér), 17°B and harvest (Har) on yield of Pinotage/99R near Robertson in the Breede River Valley. Data are means for three years. Columns designated by the same letters do not differ (p ≤ 0.05).
Blue water footprint and water use efficiency
The average WFblue of the grapes (Table 1) produced with micro sprinkler irrigation was higher than the proposed global value of 97 m3/t.14 Since most vineyards are drip irrigated,30 which generally require less water than micro sprinklers,31,32 the higher than global WFblue was to be expected. Under the prevailing conditions, the WFblue of grapes produced on the two-tier trellis was substantially lower compared to the six-strand hedge, irrespective of the level of RAW depletion (Table 1). This confirmed that it is possible to reduce the WFblue if the bearing capacity of grapevines is extended vertically. In doing so, more grapes can be produced with the same irrigation volume. Although yields were marginally lower, irrigation at 75% RAW depletion tended to reduce the WFblue of grapes produced on both trellis systems compared to irrigation at 50% RAW depletion. Furthermore, the WFblue of grapes produced on the two-tier trellis, where irrigation was applied at 75% RAW depletion, was 44% lower compared to the six-strand hedge where irrigation was applied at 50% depletion (Table 1). It should be noted that the 139 m3/t WFblue of grapes produced on the two-tier trellis was similar to 138 m3/t reported for drip-irrigated Cabernet Sauvignon grapes on a Scott Henry trellis with a vertically split canopy.29 In the latter study, the WFblue was only reduced when less irrigation caused a concomitant yield reduction. However, such an approach is certainly not an economically viable option to reduce the WFblue of wine grapes.
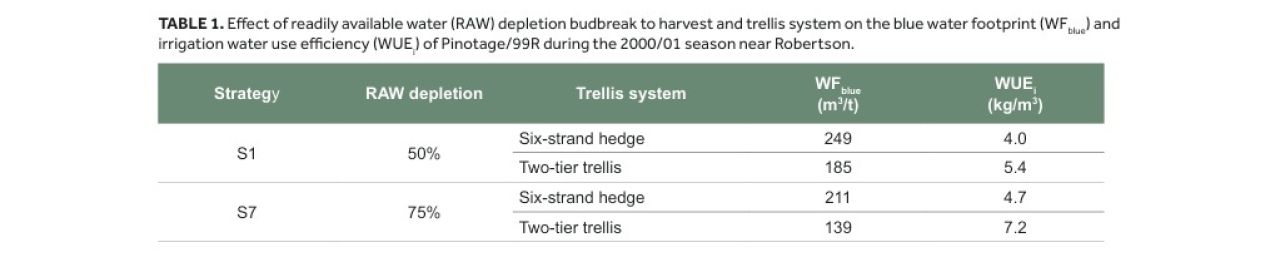
Surprisingly, the WUEi of the micro sprinkler-irrigated grapevines on the six-strand hedge (Table 8) was comparable to 5.01 kg/m3 obtained in another study,33 and even higher than 2.69 kg/m3 reported for drip-irrigated grapevines on vertical trellises.26 In contrast, the WUEi was appreciably lower than 10.4 kg/m3 obtained with drip-irrigated Merlot on a vertical trellis.10 In the case of the two-tier trellis, the WUEi of grapevines was only slightly less than the 7.9 kg/m3 of drip-irrigated Thompson seedless grapevines on a horizontally orientated trellis system in the Breede River Valley.34 The WUEi of grapes produced on the two-tier trellis, where irrigation was applied at 75% RAW depletion, was 78% higher compared to the six-strand hedge with irrigation applied at 50% RAW depletion (Table 1). This result confirmed that it is possible to increase the WUEi, or reduce the WFblue, substantially by producing more grapes with less irrigation water.
Conclusions
This was the first study where Pinotage yield responses to water deficits and trellis systems were determined. Pinotage berry mass was most sensitive to water deficits during the pre-véraison period, as well as continued water deficits from budbreak to harvest. This eventually reflected in the yield. The average yield obtained on the six-strand hedge was within the norm expected for Pinotage. The best irrigation strategy for Pinotage is to avoid water constraints during the pre-véraison period. If irrigation water is limited, or when water restrictions are imposed during droughts, irrigation can be reduced, or even terminated during the post-véraison period. Results showed that it is possible to produce more grapes with the same volume of irrigation water by extending the bearing capacity of grapevines vertically. Furthermore, it was shown that it is also possible to produce more grapes with less water, and in doing so, reduce the WFblue, or increase the WUEi, of wine grapes in a profitable way. Juice and wine responses will be presented in the next article.
Acknowledgements
- The Agricultural Research Council (ARC) and Winetech for funding the project.
- ARC for infrastructure and resources.
- Staff of the Soil and Water Science division at ARC Infruitec-Nietvoorbij for their assistance, and in particular Mr. T. Harris for his dedicated technical support.
- Staff at ARC Robertson Research Farm.
References
- Myburgh, P.A., 2018. Handbook for irrigation of wine grapes in South Africa. Agricultural Research Council, Pretoria, South Africa.
- Goussard, P., 2008. Grape cultivars for wine production in South Africa. Cheviot Publishing, Cape Town, South Africa.
- SAWIS, 2023. South Africa wine industry statistics, wosa.co.za.
- Myburgh, P.A., Van Zyl, J.L. & Conradie, W.J., 1996. Effect of soil depth on growth and water use of young Vitis vinifera L. cv. Pinot noir. S. Afr. J. Enol. Vitic. 18, 53-62.
- Conradie, W.J. & Myburgh, P.A., 2000. Fertigation of Vitis vinifera cv. Bukettraube/110R on a sandy soil. S. Afr. J. Enol. Vitic. 21, 40-47.
- Myburgh, P.A., 2003. Responses of Vitis viniferacv. Sultanina to level of soil water depletion under semi-arid conditions. S. Afr. J. Enol. Vitic. 24, 16-24.
- Myburgh, P.A., 2007. The effect of irrigation on growth, yield, wine quality and evapotranspiration of Colombar in the Lower Orange River Region. Wineland, Technical Yearbook 2007/08, 59-62.
- Bruwer, R.J., 2010. The edaphic and climatic effects on production and wine quality of Cabernet Sauvignon in the Lower Olifants River region. Thesis, Stellenbosch University, Private Bag X1, Matieland 7602, South Africa.
- Lategan, E.L., 2011. Determining of optimum irrigation schedules for drip irrigated Shiraz vineyards in the Breede River Valley. Thesis, Stellenbosch University, Private Bag X1, 7602 Matieland (Stellenbosch), South Africa.
- Myburgh, P.A., 2011. Response of Vitis viniferacv. Merlot to low frequency irrigation and partial root zone drying in the Western Cape Coastal Region - Part II. Vegetative growth, yield and quality. S. Afr. J. Enol. Vitic. 32, 104-116.
- Lategan, E.L. & Howell, C.L., 2016. Deficit irrigation and canopy management practices to improve water use efficiency and profitability of wine grapes. WRC Report No. 2080/1/16. ISBN 978-1-4312-0816-6.
- Munitz, S., Netzer, Y. & Schwartz, A., 2017. Sustained and regulated deficit irrigation of field-grown Merlot grapevines. Aust. J. Grape Wine Res. 23, 87-93.
- Vilanova, M., Rodriguez-Nogales, J.M., Vila-Crespo, J. & Yuste, J., 2019. Influence of water regime on yield components, must composition and wine volatile compounds of Vitis vinifera cv. Aust. J. Grape Wine Res. 25, 82-95.
- Mekonnen, M.M. & Hoekstra, A.Y., 2010. The green, blue and grey water footprint of crops and derived crop products. Value of Water Research Report Series No. 47, UNESCO-IHE, Delft, the Netherlands.
- Wolf, T.K., Dry, P.R., Iland, P.G., Botting, D., Dick, J., Kennedy, U. & Ristic, R., 2003. Response of Shiraz grapevines to five different training systems in the Barossa Valley, Australia. Aust. J. Grape Wine Res. 9, 82-95.
- Van Zyl, J.L. & Van Huyssteen, L., 1980. Comparative studies on wine grapes on different trellis systems: I. Consumptive water use. S. Afr. J. Enol. Vitic. 1, 7-14.
- Swanepoel, J.J., Hunter, J.J. & Archer, E., 1990. The effect of trellis systems on the performance of Vitis viniferacvs Sultanina and Chenel in the Lower Orange River region. S. Afr. J. Enol. Vitic. 11, 59-66.
- Howell, C.L. & Myburgh, P.A., 2024. Response of Vitis viniferacv. Pinotage to irrigation strategy and trellis system in the Breede River Valley Region: Vegetative growth, yield and juice characteristics. S. Afr. J. Enol. Vitic. 45, 92-106.
- Amerine, M.A. & Winkler, A.J., 1944. Composition and quality of musts and wines of California grapes. Hilgard 15, 493-673.
- Le Roux, E.G., 1974. A climate classification for the South Western Cape viticultural areas (in Afrikaans). Thesis, Stellenbosch University, Private Bag X1, 7602 Matieland (Stellenbosch), South Africa.
- Soil Classification Working Group, 1991. Soil Classification - A taxonomic system for South Africa. Memoirs on natural agricultural resources of South Africa No. 15, Dept. of Agric. Develop., Private Bag X144, Pretoria, 0001 South Africa.
- Coombe, B.G., 1995. Adoption of a system for identifying grapevine growth stages. Aust. J. Grape Wine Res. 1, 104-110.
- Hardie, W.J. & Considine, J.A., 1976. Response of grapes to water-deficit stress in particular stages of development. Am. J. Enol. Vitic. 27, 55-61.
- Santos, T.P., Lopes, C.M., Rodrigues, M.L., De Souza, C.R., Ricardo-da-Silva, J.M., Maroco, J.P., Pereira, J.S. & Chaves, M.M., 2005. Effects of partial root-zone drying irrigation on cluster microclimate and fruit composition of field-grown Castelão grapevines. Vitis 44, 117-125.
- Van Zyl, J.L., 1984b. Response of Colombar grapevines to irrigation as regards quality aspects and growth. S. Afr. J. Enol. Vitic. 5, 19-28.
- Pérez-Alvarez, E.P., Intrigliolo Molina, D.S., Vivaldi, G.A., García-Esparza, M.J., Lizama, V. & Alvarez, I., 2021. Effects of the irrigation regimes on grapevine cv. Bobal in a Mediterranean climate: I. Water relations, vine performance and grape composition. Agric. Wat. Manage. 248. https://doi.org/10.1016/j.agwat.2021.106772.
- McCarthy, G., 1997. Effect of timing of water deficit on fruit development and composition on Vitis vinifera cv. Shiraz. Dissertation, University of Adelaide, Waite Campus, PMB 1, Glen Osmond, SA 5064, Australia.
- Medrano, H., Escalona, J., Cifre, J., Bota, J. & Flexas, J., 2003. A ten-year study on the physiology of two Spanish grapevine cultivars under field conditions: effects of water availability from leaf photosynthesis to grape yield and quality. Func. Plant Biol. 30, 607-619.
- Williams, L.E. & Heymann, H., 2017. Effects of applied water amounts and trellis/training system on grapevine water relations, berry characteristics, productivity and wine composition of “Cabernet Sauvignon”. Acta Hortic. 1150, 413-426.
- Way, R., 2014. Irrigation drip system design for a vineyard. https://api.core.ac.uk/oai/oai: calpoly.edu:braesp-1140.
- Van Zyl, J.L. & Van Huyssteen, L., 1988. Irrigation systems - Their role in water requirements and the performance of grapevines. Afr. J. Enol. Vitic. 9, 3-8.
- Myburgh, P.A., 2012. Comparing irrigation systems and strategies for table grapes in the weathered granite-gneiss soils of the Lower Orange River Region. S. Afr. J. Enol. Vitic. 33, 184-197.
- Mirás-Avalos, J.M. Trigo-Córdoba, E., Bouzas-Cid, Y. & Orriols-Fernández, I., 2016. Irrigation effects on the performance of grapevine (Vitis vinifera) cv. ‘Albarino’ under the humid climate of Galicia. OENO One 50, 183-194.
- Myburgh, P.A. & Howell, C.L., 2023. Effects of soil ameliorants produced from recycled glass on the establishment of table grapes. Afr. J. Enol. Vitic. 44, 101-111.
For more information, contact Carolyn Howell at [email protected].
Click here to get your copy of WineLand Magazine.

More from
Vineyard, cellar and production
How to understand regenerative farming
Regenerative farming is becoming part of the language of modern viticulture, but what does it actually look like in a vineyard?
JC Smith praat oor wynmaak in die Oos-Vrystaat
JC Smith is ’n derdegeslag-wynmaker. Sy oupa Dassie en pa Flip was albei wynmakers, en hy het tussen wingerde en wynkelders grootgeword. Hy is tans die wynmaker by Blydschap in die Oos-Vrystaat.
Cellar hygiene
Maintaining a spotless wine cellar requires a comprehensive management plan, which includes structural design, equipment sanitation, environmental controls and routine microbial monitoring.