This study proposes a new method of creating precision input data for precision viticulture and autonomous farming applications using remote sensing.
Background
Precision viticulture (PV) and autonomous farming (AF) have emerged as a dynamic duo, reimagining grape production. These transformative practices can bring automation to existing techniques and inspire the creation of new ones, thereby making invaluable improvements to the quality and yield of grapes and promoting more sustainable farming techniques. PV approaches and AF are highly reliant on accurate crop data. Remote sensing (RS) technologies, such as unmanned aerial vehicles (UAVs), commonly referred to as drones, with their ability to capture detailed measurements from a distance, provide crucial data and insights driving automation in farming.
The model proposed by this study utilises RGB imagery (red, green and blue waveband) captured by UAVs and computer vision to detect individual vine plants. Accurate delineation of individual vines could contribute to more precise spraying of pesticides by autonomous vehicles or provide more detailed information on vine plants’ biophysical characteristics. This research demonstrates the potential of the region grow algorithm and RGB-UAV/RGB-drone imagery for individual vine extraction.
Materials and methods
The process of extracting individual vine plants was achieved through a two-step workflow, which consisted of 1) extracting vine rows, and 2) delineating individual vines. The two-step workflow is detailed in the following sections.
Part 1: Vine row extraction
Site and data
The data used was provided by Stellenbosch University’s Department of Viticulture and Oenology and consisted of drone RGB imagery captured at a 2 cm resolution. The imagery was collected over Thelema Mountain Vineyards in Stellenbosch, Western Cape of South Africa, during the 2020/2021 growing season. Additionally, ground control points (GCPs) were collected on-site, which served as a reference to digitise the outline of 13 vine plants. The digitised vines were crucial in the accuracy assessment process, as they were used to compare the model predictions with actual ground-truth values. The GCPs also provided a measurement of the average vine plant spacing in this vine parcel.
Data preparation
Three vegetation indices were created from the RGB imagery to allow for better vine row detection. The indices selected were the green leaf index (GLI), excess green-excess red (ExG-ExR) and colour of vegetation (CIV). Recommendations by De Castro and other authors (2018) informed the selection of the vegetation indices.
Row extraction and classification
The row extraction and classification process were completed using the eCognition Developer 10.2 software (Trimble Geospatial, 2022). The drone images were classified into three categories: Vine, shadow, and inter-row area (IRA) using two algorithms, multiresolution segmentation (MRS) and the decision trees (DT) classifier, also known as classification and regression trees or CART.
Part 2: Individual vine delineation
Centreline and seed extraction
The extracted vine rows were imported into ArcGIS Desktop 10.8.1 (Esri, 2020) for further processing. The workflow outlined in Figure 1 was followed to identify the centrelines of each vine row. An average vine length of 1.75 m, as determined by in-field GPS measurements, was used to generate seed points or pixels from these lines.
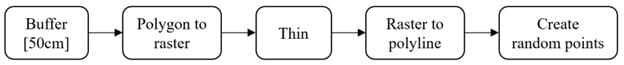
FIGURE 1. Centreline extraction workflow.
Vine plant extraction
The region grow algorithm was used to obtain the final vine plant delineation. Region grow is designed to take a seed pixel and expand it outwards to a specified bounding box threshold. The algorithm was implemented in the eCognition Developer 10.2 software (Trimble Geospatial, 2022) using the vine row polygons as the bounding boxes and the generated vine plant location estimates as the seed pixels. The vine plant extraction process was iterated 50 times to ensure that the full extent of each vine was detected.
Results
Part 1: Vine row extraction
The results from Part 1 of the process can be seen in Figures 2 and 3 below. Figure 2 depicts a zoomed-in view of the image objects generated in the segmentation process. Figure 3 shows the final row extraction results obtained through the DT classification. In Figure 3, green represents the vine, black represents the shadow and yellow represents the inter-row area (IRA). The vine rows were extracted as polygons and used as input for Part 2 of the processing workflow. It should be noted that some post-processing was required to remove grainy misclassifications and to remove grass patches incorrectly classified as a vine.
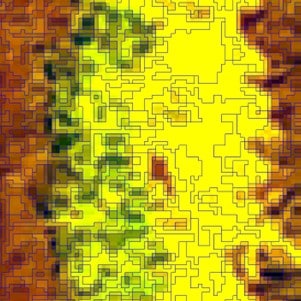
FIGURE 2. MRS segmentation at a high zoom level.

FIGURE 3. Resulting classification (three classes).
Part 2: Individual vine delineation
Figure 4 depicts the result of the penultimate phase of the workflow illustrated in Figure 1. This phase involved the creation of centrelines using the vine polygons from Figure 3. Figure 5 shows the final output of the Figure 1 workflow, showcasing the generation of seed points along the previously generated vine row centrelines. Each seed represents a prediction of a vine plant’s location.
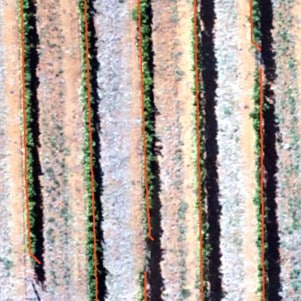
FIGURE 4. Creation of centreline (in red).
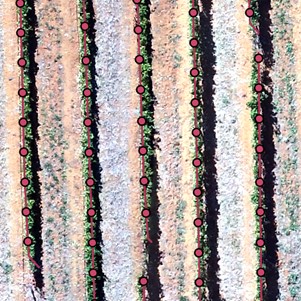
FIGURE 5. Seeds (red) generated along the centrelines.
Figure 6 shows the seeds overlaying the generated individual vine objects. The final individual vine objects can be seen in Figure 7.
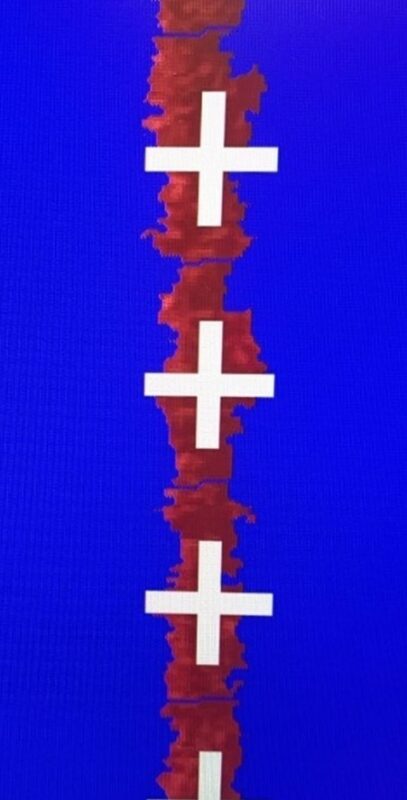
FIGURE 6. Seeds (crosses) grown.

FIGURE 7. Final region grow objects outlined in red to the extent of the vine row.
Accuracy assessment
The intersection over union (IOU) accuracy assessment was used to validate the correctness of the detected vines. This approach measures the overlap between the predicted vine areas and the ground truth values. The model achieved an IOU score of 0.54, representing moderate predictive accuracy. An area under curve (AUC) score was also employed to assess predictive accuracy, with the model producing an AUC score of 0.59. Figure 8 shows that the AUC curve lies above the 0.5 line, indicating that the model does possess a level of predictive prowess.
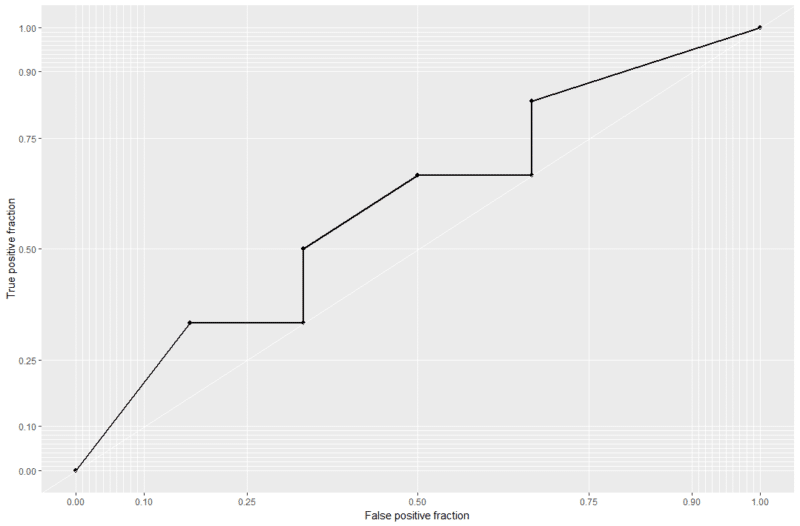
FIGURE 8. AUC curve.
Conclusion
The results highlight the potential of drone imagery for the extraction of individual vines. The IOU and AUC scores of 0.54 and 0.59 show that the model is not ready for large-scale application. However, the research does provide grounds for future research. One of the major positives of the study’s results is the demonstrated utility of RGB imagery.
While multispectral imagery is more commonly used than RGB imagery due to the usefulness of the near-infrared (NIR) band for vegetation indices, these multispectral sensors are more expensive than RGB sensors, making them less accessible, particularly for smaller farms. Using RGB drone imagery would provide affordable methods for improving farm management techniques, benefiting a broader spectrum of farmers.
The developed methodology provides a point of departure for detecting accurate vine foliage areas and vine plant locations, allowing farmers to monitor the health of individual vine plants and detect missing or dead plants. Vine-level data could also assist with more accurate automated crop spraying. With continued research and enhancements, the model has the potential to achieve greater accuracy, robustness and automation. This progress could pave the way for widespread adoption within the viticulture industry.
Abstract
Precision viticulture (PV) seeks to optimise the health and yield of vineyards by providing farmers with site-specific management schemes. Through these practices, the environmental impact of farming can be reduced. Remote sensing (RS) developments have risen through the years, and new data availability has revolutionised the PV field. While previous RS studies have attempted individual vine delineation, no industry standard exists. This study aims to delineate individual vine plants using drone-captured RGB imagery (red, green and blue waveband). The computer vision algorithm, region grow, has been investigated in a geographic object-based image analysis (GEOBIA) environment to extract individual vine plants. The model achieved an intersection over union (IOU) score of 0.54 and an area under curve (AUC) score of 0.59, representing the algorithm’s predictive performance against the ground truth. While the results indicate only moderate performance, they provide ground for further research.
References
- De Castro, A.I., Jiménez-Brenes, F.M., Torres-Sánchez, J., Peña, J.M., Borra-Serrano, I. & López-Granados, F., 2018. 3-D characterization of vineyards using a novel UAV imagery-based OBIA procedure for precision viticulture applications. Remote Sensing 10(4): 584. DOI: 10.3390/rs10040584.
- Esri, 2020. ArcGIS Desktop (Version 10.8.1). Esri: California, USA.
- Trimble Geospatial, 2022. eCognition Developer (Version 10.2). Trimble Germany GmBH: Munich, Germany.
For more information, contact Matthew Wrensch at mwrensch98@gmail.com.
Click here to get your copy of WineLand Magazine and here to subscribe to our newsletter.